
The Housing Market Is Up. It’s Down. And Both Are True.

If you’ve been following the real estate headlines lately, you might be a little confused. Prices are up. Prices are down. Inventory is growing. Inventory is shrinking. Buyers have more choices, but good houses are still selling quickly.
So which is it?
Actually, all of the above.
The problem is that we tend to talk about “the housing market” as if it’s one big market. It isn’t. And when you look at what happened across MetroWest this summer, that becomes pretty obvious.
A Tale of Two Markets
Take Medfield and Needham.
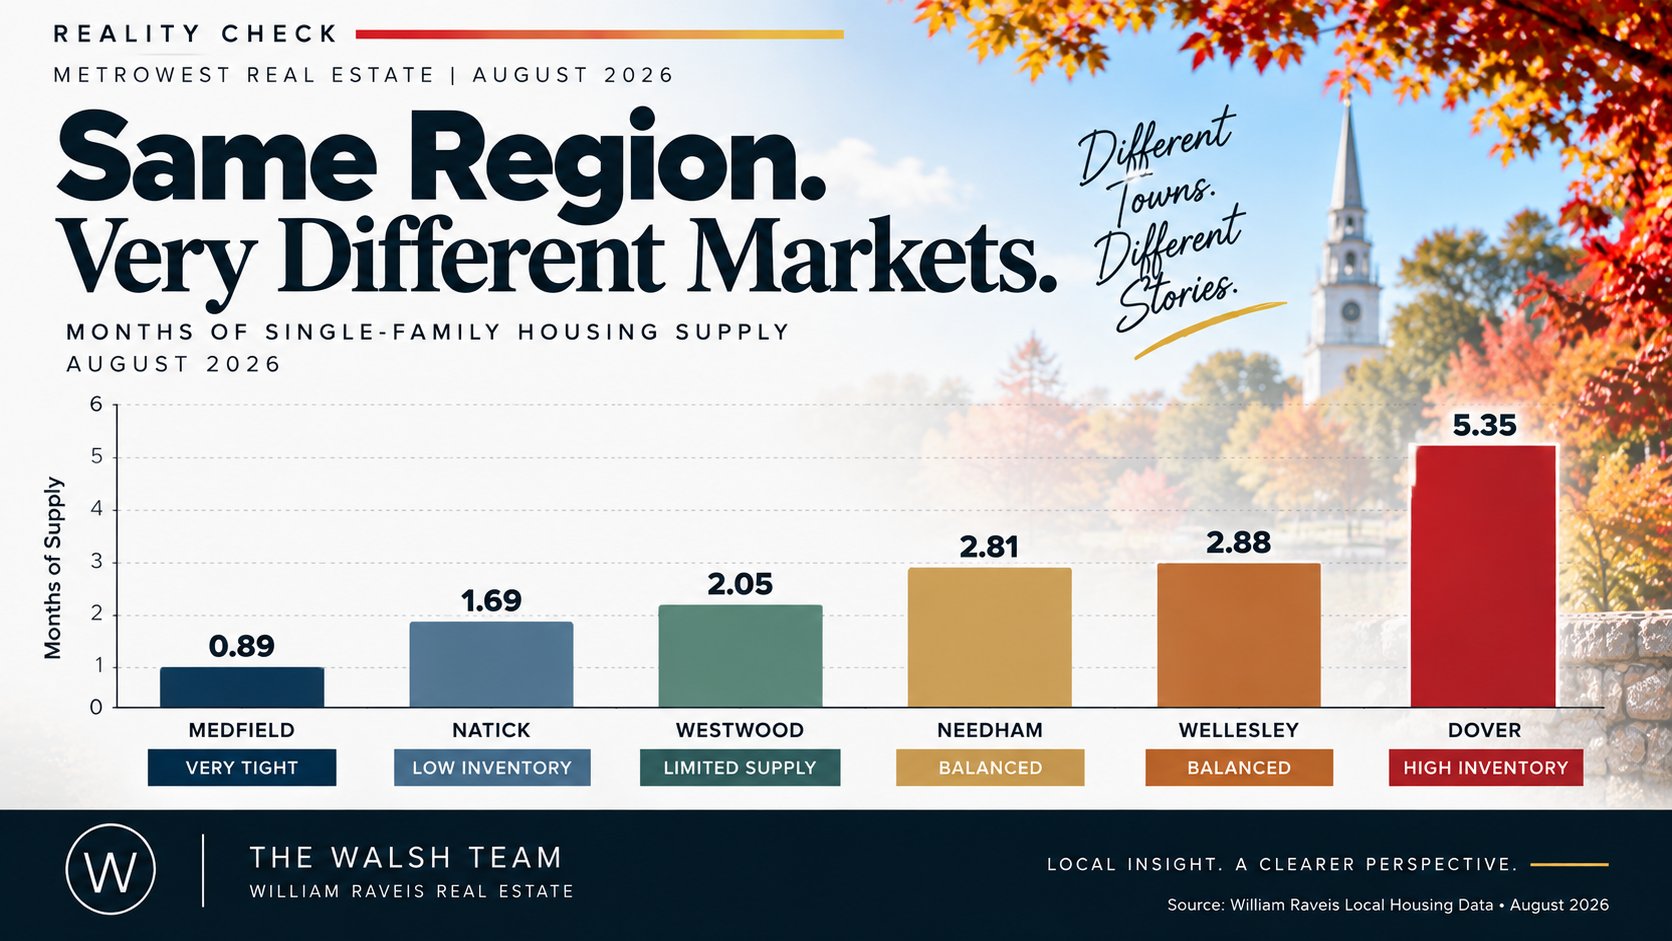
In Medfield, there were just 8 single-family homes on the market in August, 50% fewer than a year ago. That worked out to only 0.89 months of supply. Every home that sold in August sold within 90 days and for more than 95% of asking price.
Drive over to Needham and it’s a completely different story. Inventory was up 40.5%, with 59 homes available and 2.81 months of supply.
These aren’t markets hundreds of miles apart. They’re neighboring communities.
That’s why I’m always a little cautious when I hear someone say, “Here’s what the housing market is doing.”
My first question is: Which housing market?
Reality Check: In August, Medfield had 0.89 months of single-family housing supply. Needham had 2.81. Wellesley had 2.88. Westwood had 2.05. Dover had 5.35. There is no single number that accurately describes all five markets.
Prices Are Telling the Same Story
The pricing numbers are just as different.
Westwood’s median single-family sale price in August was $1.395 million, up 13.4% from last year. Wellesley was $2.27 million, down 7.3%. Needham was $1.55 million, down 23.9%.
Before anyone sees that Needham number and thinks their house just lost 24% of its value, it didn’t.
Needham’s median price per square foot actually increased 17.4% over the same period.
A median price can tell you what sold. It doesn’t necessarily tell you what your house did.
That’s why I caution people about putting too much weight on one statistic, particularly a monthly median. What happened to sell that month matters. Change the mix of properties and you can move the median significantly without the value of an individual home moving anything close to the same amount.
Dover Is a Perfect Example
There were only two single-family sales in Dover in August, and those two sales produced a median price of $2.2 million, up 26.6% from August 2025.
Technically accurate? Yes.
Am I going to tell a Dover homeowner their house went up 26.6% because two homes sold? Absolutely not.
What I find more interesting is that Dover had 29 homes available and 5.35 months of supply. Compare that with Medfield at less than one month.
Same general area. Completely different market. That difference in available inventory may ultimately tell us more about the local market than one month’s change in median price.
Natick Adds Another Wrinkle
Natick is another good example of why you have to look beyond the headline number. Its August median sale price was down 1.7%, which by itself sounds like prices softened.
But median price per square foot was up 4.8%, days on market fell 24.2%, and inventory was down 11.1%.
Is that an “up” market or a “down” market?
Again, it depends on what you’re measuring.
But It Was August…
There’s another part of this that gets overlooked when we start analyzing monthly statistics: it was August.
I live in Medfield, and locals have jokingly called it “Deadfield” during the summer for as long as I can remember. People disappear.
And it’s not unique to Medfield. In many of the communities I work in, families have summer plans. Kids are at camp. People travel. They head to the Cape, the Islands, Maine, New Hampshire or wherever they spend their summers. Some have second homes they retreat to.
Real estate tends to follow them.
Sellers may decide to enjoy the summer and wait until after Labor Day to list. Buyers go away. Open-house traffic changes. And in smaller towns, a few additional sales or listings can move the monthly statistics pretty dramatically.
Which is why I’m much more interested in what happens next.
So What Happens This Fall?
We’re halfway through September. School is back, vacations are mostly behind us and the fall market is underway.
Interest rates remain an important part of the equation. The average 30-year fixed mortgage was 6.95% as of September 17. Rates at these levels affect purchasing power, but they can also affect inventory because homeowners with mortgages in the 3% and 4% range may be reluctant to sell and replace those loans with something considerably higher.
The push and pull: Higher mortgage rates can reduce what buyers can afford while also discouraging existing homeowners from selling. That means rates can put pressure on demand and restrict supply at the same time.
My expectation for fall isn’t that everything suddenly goes up or everything suddenly goes down. I think the market becomes even more specific to the individual property.
Good houses in good locations that are priced correctly should continue to get attention, particularly where inventory remains tight. But buyers aren’t blindly chasing every new listing. They know what’s been sitting. They see price reductions. They compare condition, location, updates and value.
Two completely different housing markets can exist within the same town — sometimes within the same neighborhood.
One house can come on the market, show beautifully, be priced correctly and sell immediately, while another house a mile away sits for 60 days.
There’s nothing contradictory about that.
What This Means If You’re Selling
Low inventory can still be a big advantage, but it doesn’t mean you can put any price on a house and expect buyers to show up.
Pricing, condition and presentation matter. Professional photography, video, social media, digital exposure and personal networks all help create attention and maximize exposure, but marketing can’t completely overcome the wrong price.
For sellers: The advantage isn’t simply having less competition. It’s taking advantage of that environment with the right pricing, preparation, presentation and marketing strategy from day one.
What This Means If You’re Buying
Don’t assume there are no opportunities because you keep hearing inventory is tight. In some towns it absolutely is. In others, buyers have considerably more choice.
Sometimes the opportunity isn’t a particular town at all. It’s a house that has been overlooked because of condition, timing, presentation or price.
And interest rates are only one part of that equation. A lower rate sounds great, but not if it brings significantly more buyers through the same front door and pushes the purchase price higher. Price, rate, competition and negotiating leverage all matter.
So, Is the Housing Market Up or Down?
Yes.
That’s probably the most accurate answer I can give you right now.
We’re heading into fall with dramatically different inventory levels from town to town, mortgage rates affecting both buyers and sellers, and the normal return of activity after the summer slowdown.
The next several weeks should tell us a lot about how the MetroWest market sets up for the remainder of 2026.
In the meantime, don’t make a real estate decision based solely on a national headline. I’d be careful making one based on a Massachusetts headline. Frankly, I’d even be careful making one based on a MetroWest headline.
Start with your town, your neighborhood, your price point and your house. That’s the market that actually matters.